

Rhetoric About Crime Doesn’t Meet Reality
By Jason Pye | Due Process Institute | Vice President
Political rhetoric surrounding the issue of crime has intensified in recent weeks, with the Trump administration focusing its attention chiefly on the District of Columbia. This led to the unprecedented step of the federal government taking control of the Metropolitan Police Department, using federal agents for policing, and mobilizing the National Guard to patrol D.C.’s streets. The administration has also threatened to send the National Guard into other cities, such as Chicago, Los Angeles, and New York.
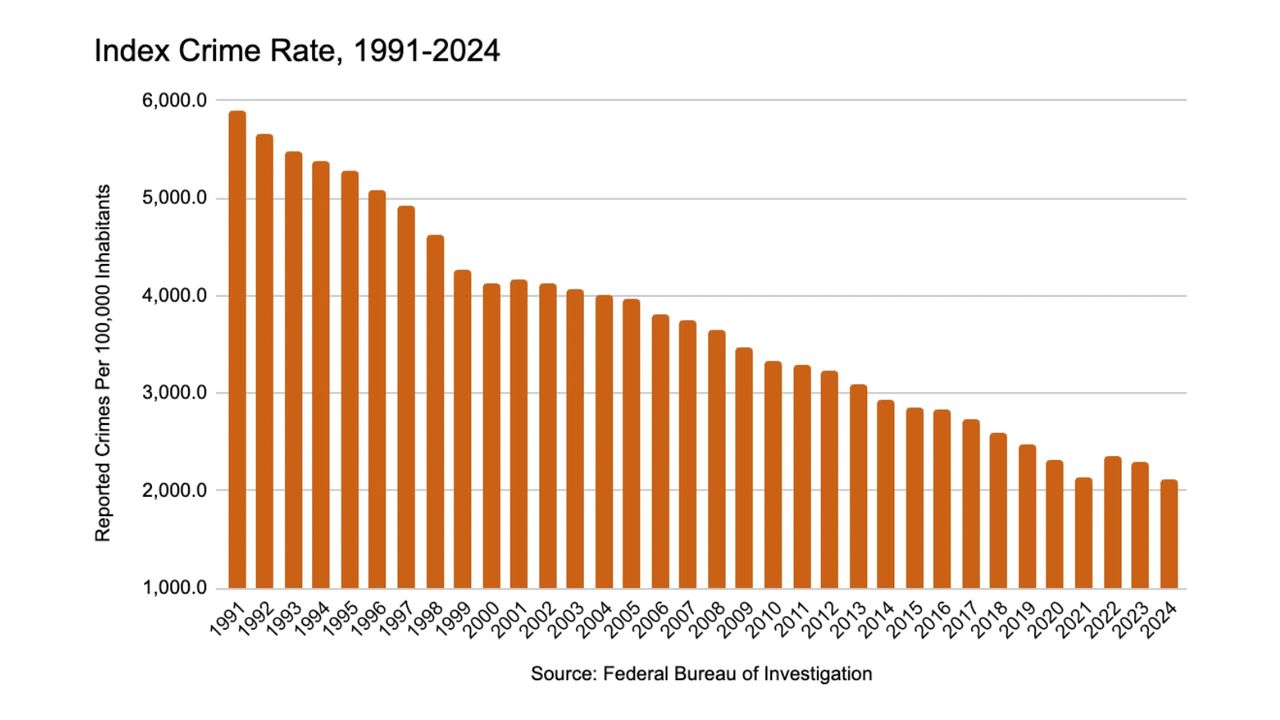
It’s unclear whether the focus on crime is an attempt to distract the American public from other issues or a legitimately held belief that crime in the United States is out of control. However, we do know from reliable data that index crime[1] (the sum of violent and property crime) in 2024 was at its lowest point since it peaked in 1991. The following data are lifted from the FBI’s recent release of the 2024 iteration of Crime in the United States.
Violent Crime and Property Dropped to Their Lowest Points Since the Late ‘60s
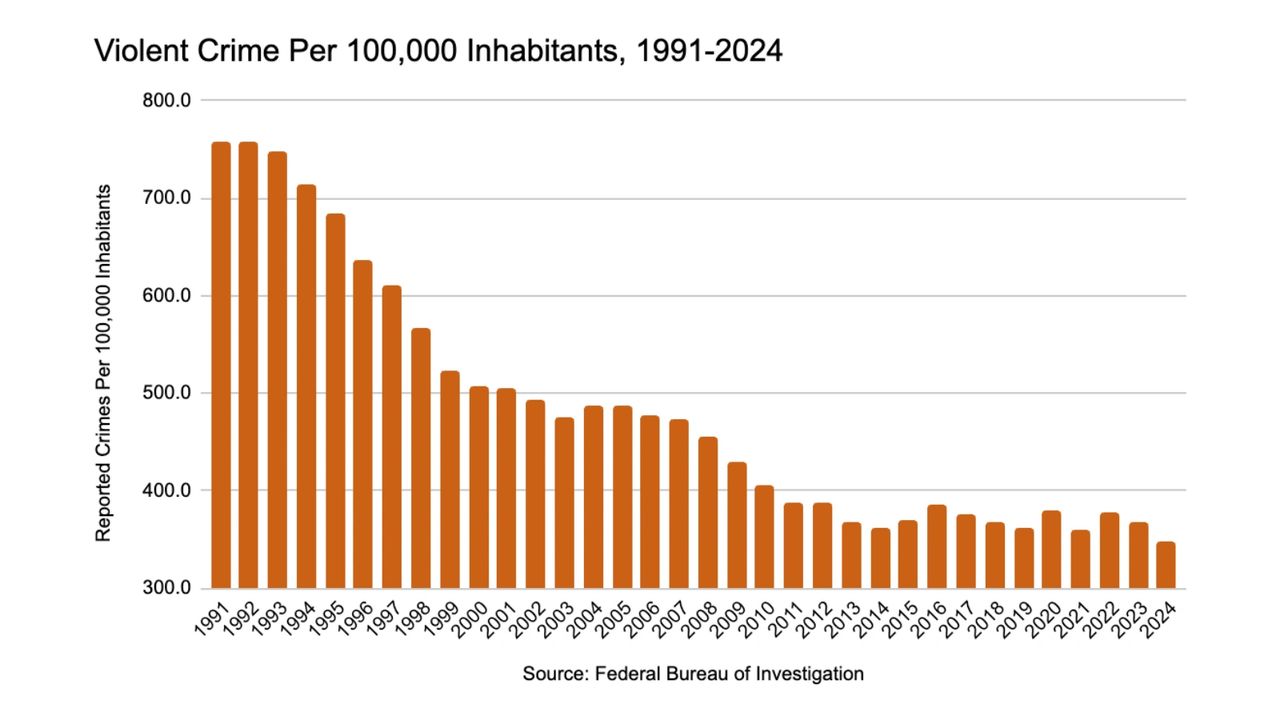
Violent crime—defined as murder and nonnegligent manslaughter, rape, robbery, and aggravated assault—also fell to its lowest point since peaking in 1991. In 2024, the violent crime rate was 348.6 reported crimes per 100,000 inhabitants. This is a critically important point. Before 2024, the year with the lowest violent crime rate was 2014.[2] Although violent crime declined, it still didn’t fall back to the pre-spike level we saw in 2014. Of course, the decrease was short-lived as the nation wrestled with a global pandemic, severe economic uncertainty, challenging racial unrest, and extreme political divisiveness in 2020. Violent crime increased in 2020 to 380.3 reported crimes per 100,000 inhabitants.
The more significant takeaway from the data is that the violent crime rate in 2024 is the lowest recorded since 1969. That’s right, friends. Jeff Asher notes that the violent crime rate in 1969 was 327.0 reported crimes per 100,000 inhabitants. (It’s worth noting, as Asher explains at the link, that the “available data from 2024 and the first third of 2025 suggests a strong possibility that the United States will report the lowest murder rate ever recorded, the lowest property rate ever recorded, and the lowest violent crime rate since 1968.”)
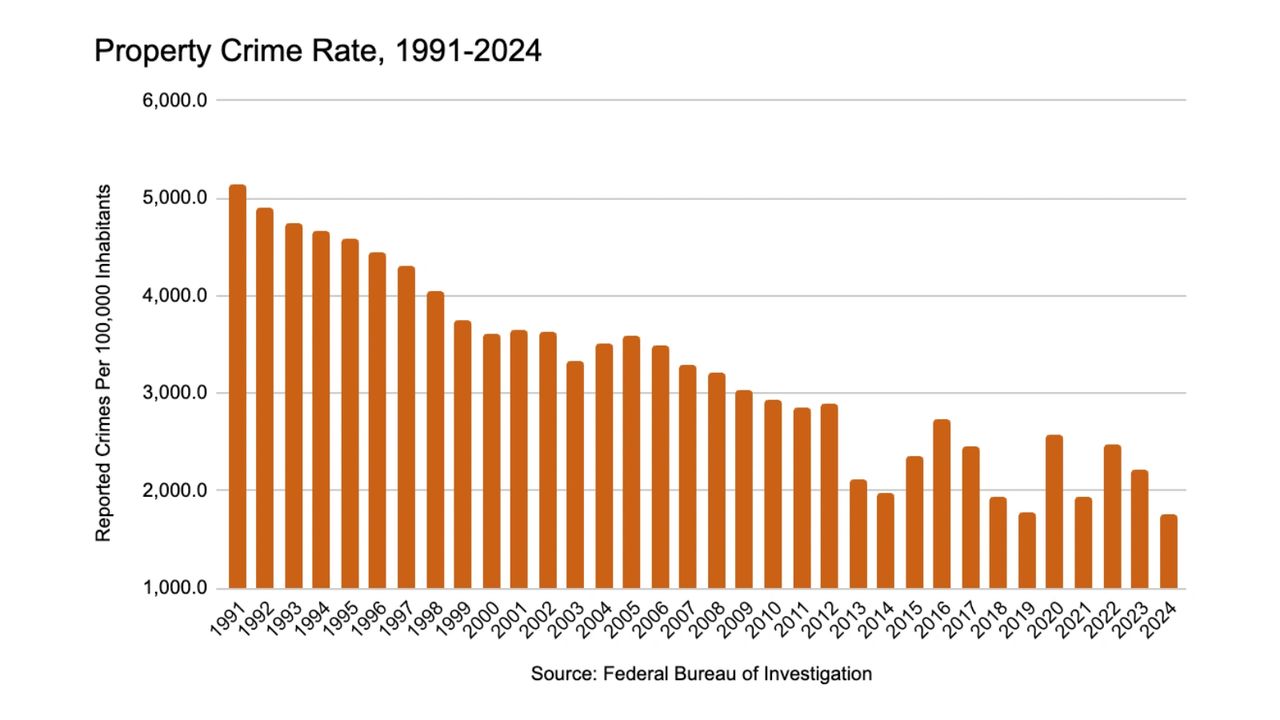
Property crime also recorded its lowest level since peaking in 1991. Property crime is defined as burglary, larceny, and motor vehicle theft. Each of the three property crime categories experienced declines, with burglary and larceny recording the lowest rates since the highs in the early 1990s. Although motor vehicle theft is still above its lowest point since the early ‘90s—recorded in 2014, at 215.3 reported crimes per 100,000—the 258.8 reported crimes per 100,000 inhabitants recorded in 2024 is a sharp drop from the rate of 321.3 in 2023.
State and City Violent Crime Rates
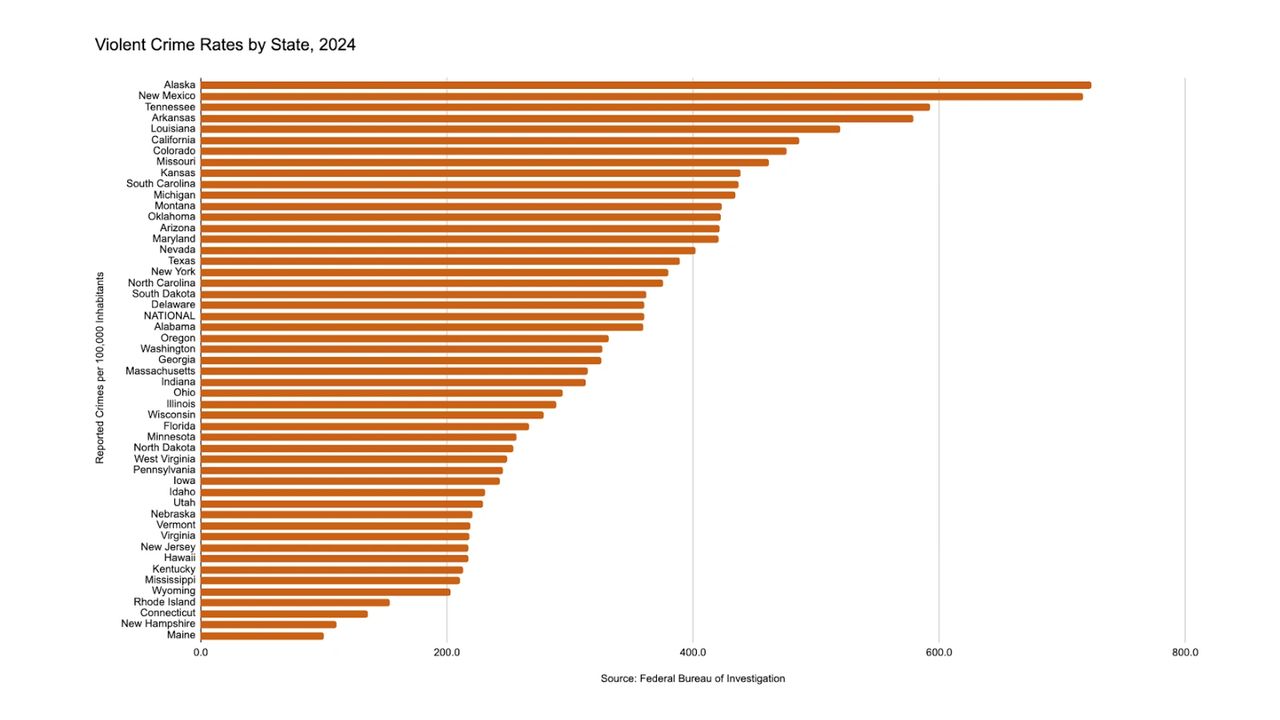
Looking at the states, the states with the highest violent crime rates were Alaska (724.1 reported crimes per 100,000 inhabitants), New Mexico (717.1), Tennessee (592.3), Arkansas (579.4), and Louisiana (519.8). The states with the lowest violent crime rates were Wyoming (203.4), Rhode Island (153.6), Connecticut (136.0), New Hampshire (110.1), and Maine (100.1).
The FBI collected data for 87 cities with a population above 250,000 people. Rather than provide the violent crime rates for each of these cities, we’ll focus on the top 20. Although Chicago, Los Angeles, New York, and San Francisco are targets of focus from the current Administration, none of these cities appear in the top 20. Los Angeles is 32nd on the list. New York is 39th. San Francisco is 46th. Chicago is 54th. Cities with higher violent crime rates (other than those not listed in the chart below) include Cincinnati, Winston-Salem, Corpus Christi, and Lubbock. Oklahoma City ranks only one spot higher than Los Angeles. What about the District of Columbia? It’s only 19th. The city with a population of over 250,000 inhabitants and the highest violent crime rate is Memphis. Others include familiar locations, but there is certainly a healthy mix of cities in both red and blue states.
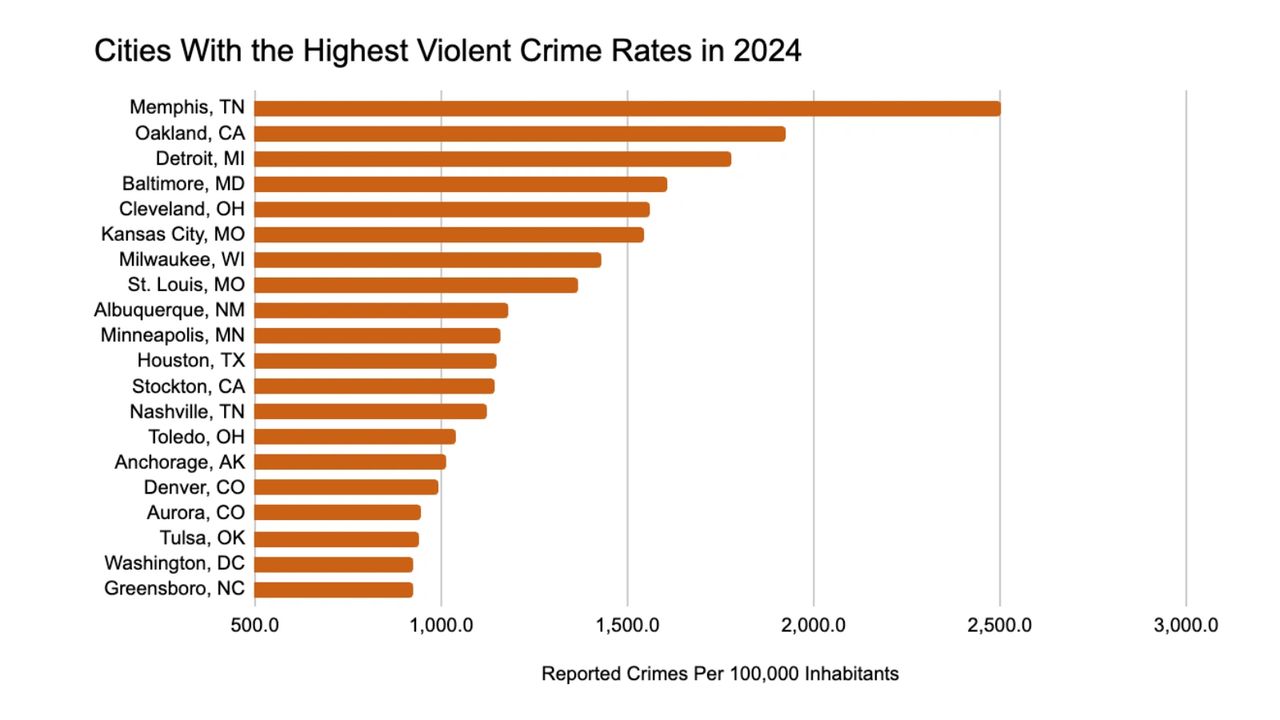
Although some of these cities have seen declines in violent crime in recent years, we would be remiss if we didn’t acknowledge that crime is still a problem in these cities. And addressing this complex concern requires local, state, and federal officials to work together—including across party lines—to solve it.
Most Americans Believe Crime Is Rising When It’s Actually Declining Because Crime Is Used As a Bludgeon by the Political Class to Create Fear
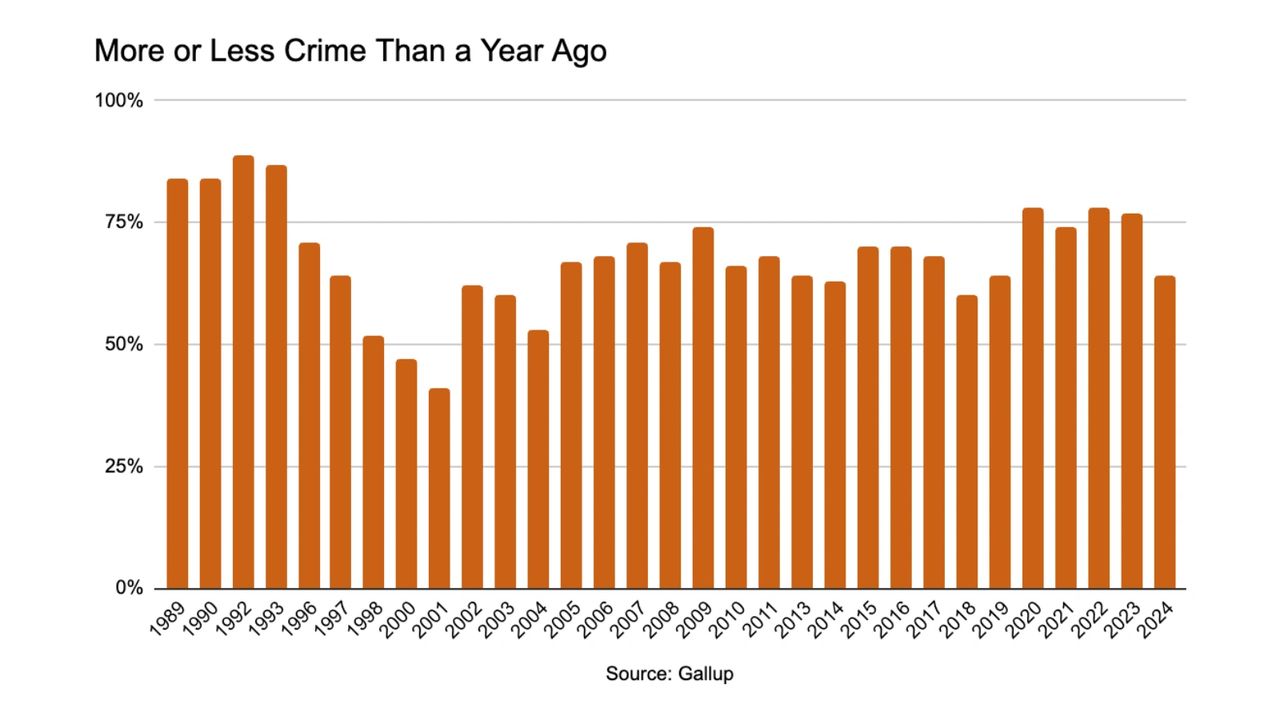
Some may argue that the public’s perception of crime is what truly matters. “Perception is reality,” they’ll say. Public opinion polls have consistently shown a disconnect between perceptions of crime and the actual data, which indicates a decline in crime. Nearly every year in the 2000s, at least 60 percent of Americans believed there was more crime than the previous year. (The lone exception was in 2004, when 53 percent believed there was more crime than the year before.) Perhaps the perception exists because the political class uses the issue of crime as a bludgeon every election cycle. After all, the use of fear in electoral politics is an easy and cheap way to score points.
It has been suggested that the FBI has “doctored” data in the past to make crime appear lower than it really is. This narrative is based on the fact that there were later revisions made to the FBI’s data for 2021 and 2022. Unfortunately, we do not entirely know why the revisions were made as the FBI failed to make a public announcement about it. However, we tend to view this situation as being caused by a change in how the data is collected. In 2021, the National Incident-Based Reporting System (NIBRS) became the primary method for reporting crime data to the FBI and it appears that not all law enforcement agencies were ready for the switch.
The FBI initially reported a violent crime rate for 2021 of 387.0 reported crimes per 100,000 inhabitants. That was revised at some point in 2024 to 377.1. You may say, “Well, violent crime dropped. That’s good news, right?” Yes and no. We tend not to pay attention to the 2021 data due to the previously noted reporting issues and poor population coverage. The violent crime rate for 2022 was also revised downward from 380.7 reported crimes per 100,000 inhabitants to 377.1. On paper, it looks like crime increased between 2021 and 2022.
Unfortunately, there were allegations of a conspiracy to hide an increase in violent crime by releasing initially faulty data, only to later quietly update it with more accurate data. This was a topic in a December 2024 House Crime Subcommittee hearing. It’s much less politically salient to simply concede that there was a change in how the data are collected, which created a need for revisions. That being said, it’s a learning experience for the Department of Justice (DOJ) and the FBI to have some form of public communication when the data have been revised and why. Trust in institutions is already so low, and everything is a conspiracy in this era of hyper-polarization. It was an unforced error, and it shouldn’t happen again.
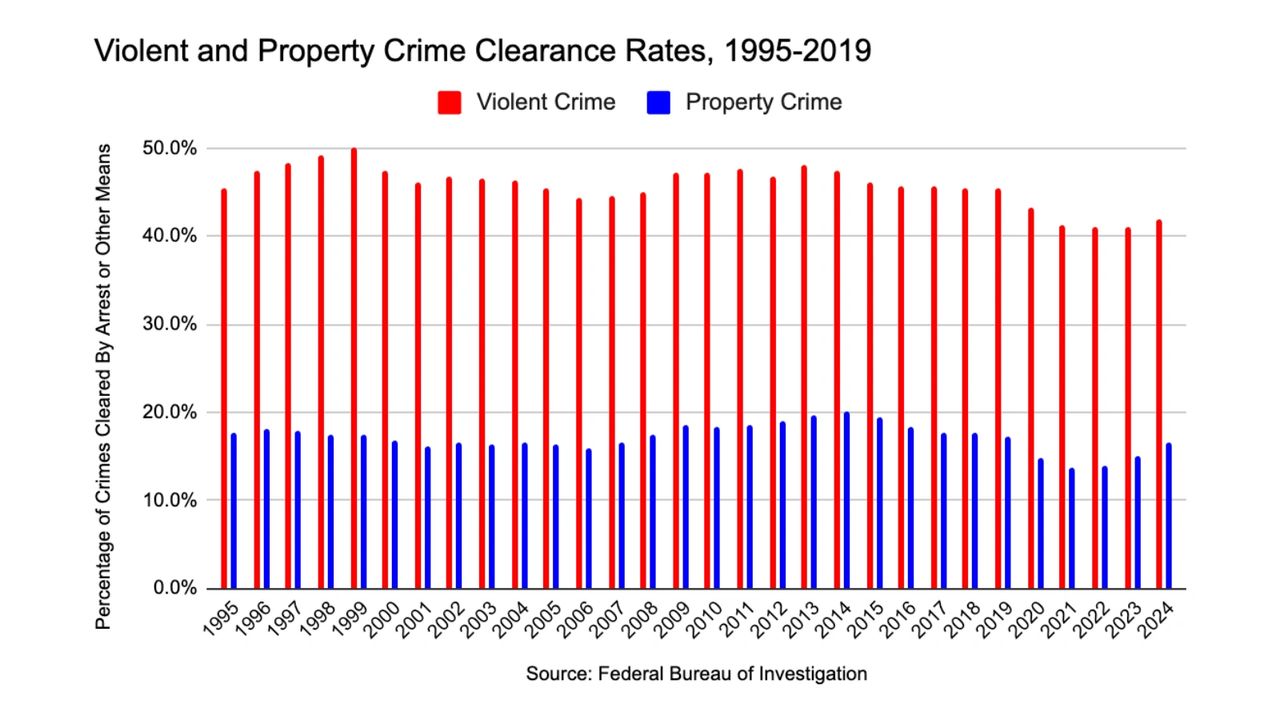
The issue of crime should not be a partisan political issue, and it needs to be examined holistically rather than through that lens. For example, is law enforcement clearing crimes? Overall, in 2020, 33.7 percent of crimes were cleared by arrest or extraordinary means. In 2024, it was 35.7 percent. However, the clearance rate for violent crimes has actually declined slightly since 2020, from 43.2 percent to 41.9 percent. However, for historical context, we can see that the clearance rate for violent crime is well below the peak in 1999. The clearance rate for property crime is also down from the peak in 2014.
Instead of threatening to increase penalties–a step that has been proven to have little effect in deterring crime–we need politicians to not only focus on clearance rates but the many other concerns faced by communities who are experiencing high crime rates. Poverty is often pervasive in these communities. There is also usually a lack of economic opportunity. There are also the health issues of addiction and mental health that often go unaddressed. There are other societal factors that have contributed to the concentration of disadvantaged people in these cities, including redlining, housing segregation, and failing public schools. Yet these issues continue to receive less focus from federal, state, and local governments than they deserve.
Congress and state legislatures routinely ignore these long-standing issues; some may even be concerned they will be labeled as “woke” for acknowledging them. That policy choice only continues the cycle of crime and violence in these communities. The people who live in these communities deserve better than being caught in a “no-man’s land” in the political culture war.
[1] When we discuss crime in recent years, we tend not to put much stock into the 2021 crime figures because nearly 25 percent of the population isn’t captured. The average population captured by the UCR from 2001 through 2020 is about 94 percent. In 2023, approximately 92 percent was captured and in 2024, it was nearly 96 percent.
[2] Violent crime experienced an uptick in 2015 and 2016 before declining in 2017, 2018, and 2019.